peter (admin) -

Kubernetes Networking Model
Let's start a new section where we will learn about Kubernetes networking concepts and how Pods, Services, and nodes communicate with each other inside the cluster.
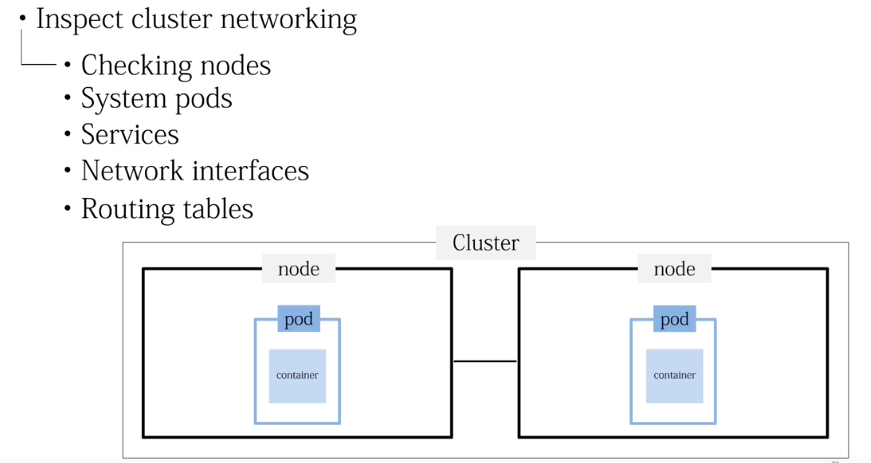
So, let's start with the Kubernetes networking model.
Here we will learn how to inspect cluster networking by checking nodes, system Pods, Services, network interfaces, routing tables, and open ports on the Worker node.
Let's get started.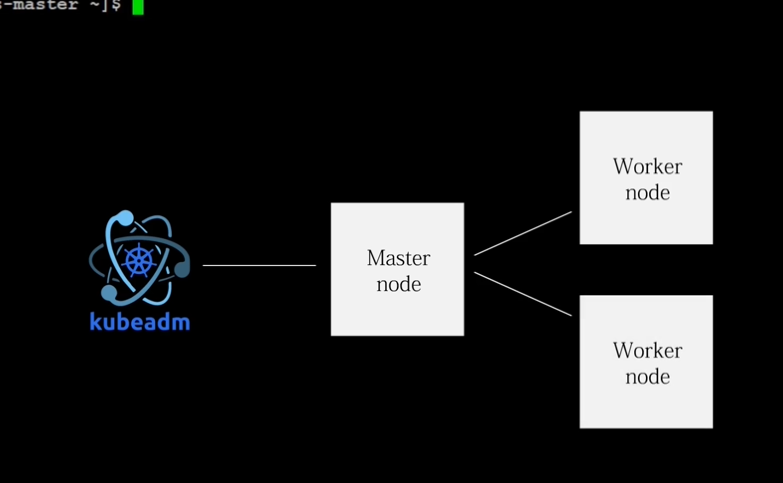
For this, we are already logged into both the Master node and the Worker node, because in a Kubeadm-based Kubernetes cluster, the control plane and the workload nodes run on separate machines.
This allows us to observe how networking behaves across different nodes in a real multi-node environment.
Unlike Minikube, which usually runs everything on a single machine for learning purposes, Kubeadm-based Kubernetes helps us learn real cluster networking where Pods, Services, and traffic move between multiple nodes.
Check the Kubernetes Nodes
Let's move on and first get the nodes with the -o wide command to view the nodes in the cluster with their network details.
kubectl get nodes -o wide
After pressing Enter, the output shows two nodes, k8s-master and k8s-worker1, both in the Ready state, which means they are properly connected to the cluster.

The important part is the Internal IP, which shows 192.168.2.79 for the Master and 192.168.2.98 for the Worker.
These internal IP addresses are the actual network identities of the nodes inside the cluster, and Kubernetes uses them for communication between nodes, Pods, and Services.
Check the Kubernetes System Pods
Next, we check the system Pods running in the Kubernetes-controlled environment to understand how cluster networking is working internally.
kubectl get pods -n kube-system -o wide
After pressing Enter, the output lists important system components such as CoreDNS, kube-proxy, kube-apiserver, controller-manager, scheduler, and etcd, all running in the system namespace.The key part here is the IP column, where you can see addresses like 10.244.x.x.

These are Pod network IPs assigned by the cluster network plugin.
This means every Pod gets its own internal IP address inside the cluster network.
Using this IP, Pods can communicate directly with other Pods across different nodes without using NAT.
The network plugin creates routing rules so traffic sent to these Pod IPs is correctly delivered to the node where the Pod is running.
Because of this, a Pod on the Master node can reach a Pod on the Worker node using the Pod IP just like normal network communication.
Check the Network Plugin
Now we check the network plugin Pods running in the cluster to understand how communication between nodes is handled.
kubectl get pods -n kube-flannel -o wide

After pressing Enter, the output shows the Flannel Pods, which are responsible for managing the cluster networking.
Flannel creates a virtual network across all nodes, which means it builds a software-based network that connects the machines together so Pods can communicate even if they are running on different nodes.
Here you can see one Flannel Pod on the Worker node and one on the Master node, which means each node runs a Flannel service that forwards and routes Pod traffic so Pods can reach each other using their Pod IP addresses.
Check All Pods Across the Cluster
Then we check all Pods running across the entire cluster to understand how networking is distributed between namespaces and nodes.
kubectl get pods -A -o wide
After pressing Enter, the output lists Pods from different namespaces such as default, kube-system, and kube-flannel, along with their Pod IP addresses and the nodes where they are running.
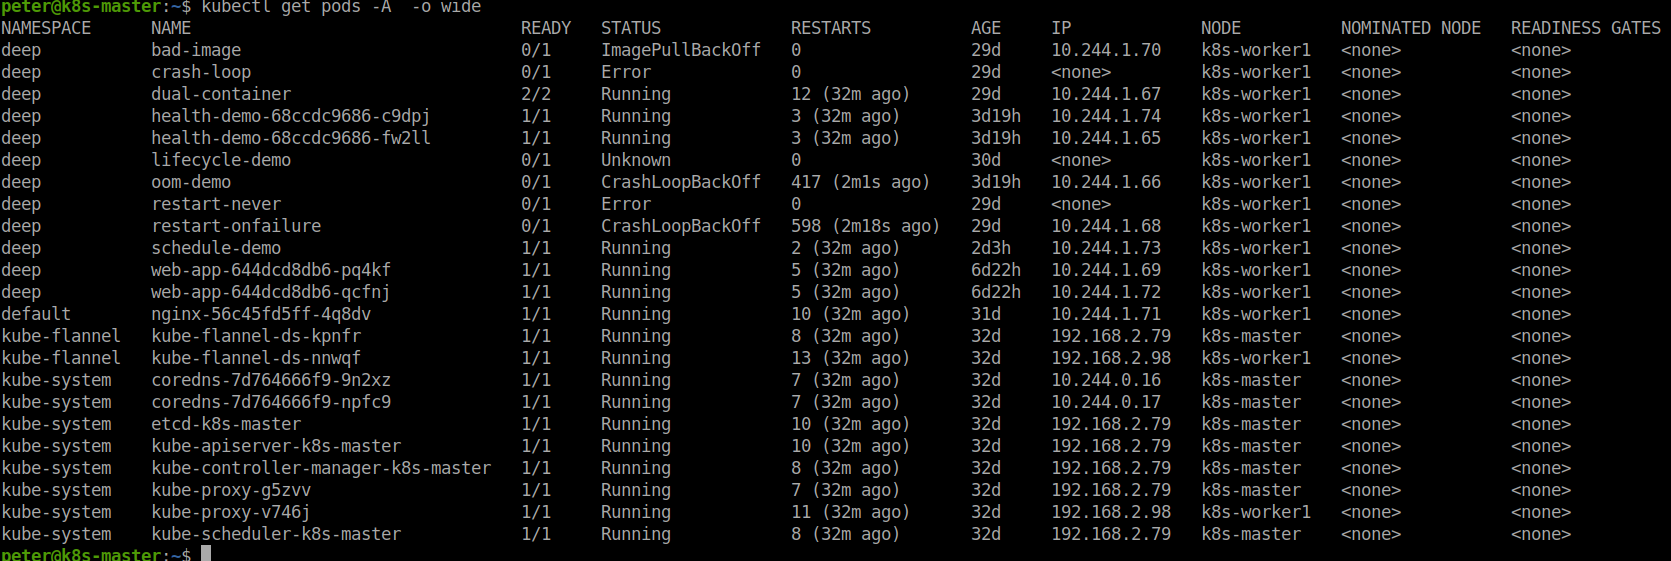
The important part is again the IP column where addresses like 10.244.x.x appear.
These are the internal Pod network addresses created by the cluster network plugin.
This shows that every Pod, regardless of its namespace, receives its own network identity and can communicate with other Pods across nodes through the cluster network.
Check Kubernetes Services
Then we check the Services running in the cluster across all namespaces to understand how applications are exposed through the Kubernetes network.
kubectl get svc -A -o wide
After pressing Enter, the output lists Services such as kubernetes, nginx, and kube-dns, along with their Cluster IP addresses and ports.

The important part is the ClusterIP column, which shows internal Service addresses such as 10.96.x.x.
These Service IPs act as stable network entry points, meaning other Pods communicate with the Service using this IP.
Kubernetes automatically forwards the traffic to the correct Pods running behind that Service.
Check Network Interfaces on the Worker Node
Let's move on to the Worker node to verify the network interfaces of the machine.
For this, we use the ip address command because it shows all network interfaces that Kubernetes and the network plugin create to move traffic between Pods and nodes.
ip -4 address
After pressing Enter, the output shows the enp0s3 interface with IP 192.168.2.98, which is the node's main physical network address.
This is the IP used when the Master node communicates with the Worker node, such as when the control plane sends instructions or when node-to-node traffic travels across the real network.
Next, you can see the cni0 interface with the address 10.244.1.1, which is the local bridge network for Pods running on this Worker node.
When a Pod is created on this node, it receives an IP such as 10.244.1.x, and its traffic first goes through this bridge so Pods on the same node can communicate directly.
Then there is the flannel.1 interface, which is created by the Flannel network plugin.
This interface is responsible for sending Pod traffic between nodes.
For example, if a Pod on the Master node with IP 10.244.0.x wants to communicate with a Pod on this Worker node with IP 10.244.1.x, the packet travels through the Master node network, reaches the Worker node using the node IP 192.168.2.98 and then Flannel forwards it to the correct Pod through the CNI bridge network.
In simple terms, the node IP handles communication between machines, while the Pod network addresses handle communication between Pods.
The Flannel and CNI interfaces work together to move that traffic across the cluster.
Check the Routing Table
Then we check the routing table of the Worker node to understand how network traffic is forwarded between nodes and Pods.
After pressing Enter, the output shows several routing rules that tell the system where to send network packets.
For example:
ip route
The first entry shows the default route through 192.168.2.1 using the enp0s3 interface.
This means any traffic going outside the local network is sent through the main network gateway.
Next, you can see a rule for:
10.244.0.0/24
through the Flannel interface.
This means that if this Worker node needs to communicate with Pods that belong to another node, the packet will be sent through the Flannel network so it can reach the correct node in the cluster.
Then the route:
10.244.1.0/24
through the CNI interface shows the local Pod network of this Worker node.
This means any Pod traffic inside this node stays within this bridge network.
In simple terms, when a Pod on this Worker node sends traffic to another Pod on the same node, the packet goes through CNI.
When it needs to reach a Pod on another node, the packet goes through Flannel, which forwards it across the cluster network.
Check Network Ports
Then we check the network ports and Services running on the Worker node to see which processes are actively listening for network traffic.
For this, we use a command that displays TCP and UDP listening sockets.
For example:
ss -tuln
This helps us understand what Services on the node are ready to receive connections.
After pressing Enter, the output shows several ports, such as 22 and others.
Here, port 22 shows that the SSH Service is listening, which allows administrators to connect to the Worker node remotely.
You can also see addresses such as 0.0.0.0, which means the Service is listening on all network interfaces.
This means traffic coming from the cluster network or external network can reach that Service.
This output helps us confirm that the node has active network Services and that the operating system is properly accepting and managing incoming connections.
Kubernetes Networking Overview
So, this is a simple explanation of how to understand Kubernetes cluster networking by observing nodes, system Pods, Services, network interfaces, routing tables, and open ports on the Worker node.
These components work together to provide communication between Pods, Services, and nodes across the Kubernetes cluster.
The basic networking flow can be summarized as:
Pod
  ↓
CNI Bridge
  ↓
Flannel
  ↓
Node Network
  ↓
Flannel on Destination Node
  ↓
CNI Bridge
  ↓
Destination Pod
Understanding these components makes it easier to troubleshoot Kubernetes networking problems by identifying where traffic is being routed and where communication may be failing.
Comments (0)
There are no comments yet. Be the first to comment.
Log in or register to leave a comment. all comments are subject to admin approval