peter (admin) -

Analyzing Kubernetes Pod Logs and Events
Introduction
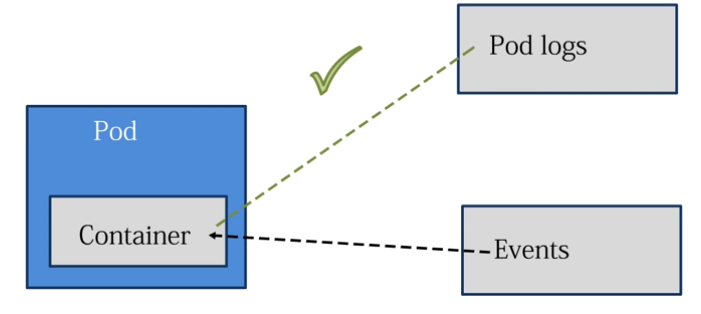 Now we will learn how to analyze Pod logs and Kubernetes events to understand what is happening inside containers and why certain actions or failures occur.
For this demonstration, we are already logged into both the control-plane node and the worker node.
We will create a Pod that continuously generates output and then use Kubernetes logging and event commands to examine its behavior.
Creating a Pod That Generates Logs
First, create a Pod named log-demo so that we can generate continuous output and later analyze it using Kubernetes logging tools.
We use the BusyBox image and set the restart policy to Never.
Setting the restart policy to Never means that if the container stops, Kubernetes will not automatically restart it. This keeps the behavior simple for our logging demonstration.
Inside the container, we run a shell loop that continuously prints the current date and time every two seconds.
For example:
kubectl run log-demo
  --image=busybox
  --restart=Never
  --command -- sh -c 'while true; do date; sleep 2; done'
The important part of the command is:
while true; do
    date
    sleep 2
done
This creates an infinite loop.
The date command prints the current date and time, and:
sleep 2
waits for two seconds before the loop repeats.
Because this command continues running, the container continuously generates output that we can examine using Kubernetes logging tools.
Checking the Pod Logs
After successfully creating log-demo, check its output with:
kubectl logs log-demo
The kubectl logs command displays output written by the container to standard output and standard error.
You should see multiple lines containing dates and times, for example:
Wed Sep 2 07:40:02 UTC 2026
Wed Sep 2 07:40:04 UTC 2026
Wed Sep 2 07:40:06 UTC 2026
Wed Sep 2 07:40:08 UTC 2026
A new timestamp is generated every two seconds by the loop running inside the container.
This confirms that the container is actively running and continuously generating log output that Kubernetes can retrieve.
Following Logs in Real Time
We can also observe the logs continuously in real time.
For this, use the -f option:
kubectl logs -f log-demo
The -f option means follow.
Instead of displaying the existing logs and immediately returning to the terminal, kubectl continues waiting for new output.
You should see new timestamps appearing repeatedly:
Wed Sep 2 07:41:10 UTC 2026
Wed Sep 2 07:41:12 UTC 2026
Wed Sep 2 07:41:14 UTC 2026
Wed Sep 2 07:41:16 UTC 2026
Because the container prints the date every two seconds, Kubernetes retrieves that output and displays it in the terminal.
This live stream allows us to monitor the behavior of a running container as new log entries are produced.
To stop following the logs, press:
Ctrl+C
Describing the Pod
Next, examine the Pod in greater detail:
kubectl describe pod log-demo
The output provides detailed information about the Pod and its container.
It shows that the container uses the BusyBox image and executes a loop that continuously prints the current date and time.
The container section also shows information such as:
State:       Running
Ready:       True
The output also contains information about mounted volumes, ServiceAccount access, and Pod conditions such as:
Initialized
Ready
ContainersReady
PodScheduled
These conditions help us understand the current state of the Pod.
Examining Pod Events
At the bottom of the kubectl describe output is the Events section.
Events provide a history of important actions Kubernetes has performed for the Pod.
For example, you may see events corresponding to:
Scheduled
Pulling
Pulled
Created
Started
These events describe the sequence Kubernetes followed while starting the Pod.
Scheduled
The Kubernetes scheduler selected a node on which the Pod should run.
Pulling
The kubelet requested the required container image.
Pulled
The image was successfully obtained or was already available on the node.
Created
The container runtime created the container.
Started
The container was successfully started.
Together, these events allow us to follow the startup lifecycle of the Pod.
Viewing Cluster Events
We can also retrieve events directly using kubectl.
Run:
kubectl get events
This displays events associated with resources in the current namespace.
Events are particularly useful when troubleshooting because they can reveal actions and failures that are not obvious from the normal Pod status.
Sorting Events by Creation Time
To make the sequence of events easier to understand, we can sort them by their creation timestamp:
kubectl get events --sort-by=.metadata.creationTimestamp
The option:
--sort-by=.metadata.creationTimestamp
tells kubectl to sort the results according to the event object's creation timestamp.
This makes it easier to examine the sequence in which events occurred.
Understanding Image Events
For example, you might see messages relating to NGINX from Pods created during earlier exercises:
Pulling image "nginx"
Successfully pulled image "nginx"
These messages indicate that the kubelet requested the NGINX container image and that the image was successfully obtained from the registry.
Events like these are useful when diagnosing image-related problems.
For example, if Kubernetes cannot obtain an image, the events can help identify that the failure occurred during the image-pulling stage.
Understanding BackOff Events
You may also see warning events associated with the restart-onfailure Pod created in the previous exercise.
For example:
Back-off restarting failed container crash in pod restart-onfailure
This tells us that a container has repeatedly failed.
Kubernetes has attempted to restart it, but because the container continues to fail, Kubernetes begins increasing the delay between restart attempts.
This behavior is associated with the familiar:
CrashLoopBackOff
status.
Events therefore provide important information about why a Pod has entered a particular state.
Events for log-demo
The most recent events should include those associated with our log-demo Pod.
They may show a sequence similar to:
Scheduled
Pulling
Pulled
Created
Started
This allows us to track how Kubernetes handled the Pod step by step, from scheduling through container startup.
Logs vs. Events
It is important to understand the difference between container logs and Kubernetes events.
Container logs show output generated by the application or process running inside a container.
For example:
kubectl logs log-demo
shows the output generated by our BusyBox container.
In this exercise, that output consists of timestamps:
Wed Sep 2 07:45:02 UTC 2026
Wed Sep 2 07:45:04 UTC 2026
Wed Sep 2 07:45:06 UTC 2026
Kubernetes events, on the other hand, describe actions and conditions relating to Kubernetes resources.
For example:
kubectl get events --sort-by=.metadata.creationTimestamp
can tell us that Kubernetes:
Scheduled the Pod
        |
        v
Pulled the image
        |
        v
Created the container
        |
        v
Started the container
Or, when something goes wrong:
Container started
       |
       v
Container failed
       |
       v
Kubernetes restarted it
       |
       v
Container failed again
       |
       v
BackOff
Using Logs and Events for Troubleshooting
Logs and events complement each other when troubleshooting Kubernetes.
If a Pod is running but the application is behaving incorrectly, start by examining its logs:
kubectl logs <pod-name>
To follow those logs:
kubectl logs -f <pod-name>
If the Pod cannot start or Kubernetes is reporting an error, examine the Pod:
kubectl describe pod <pod-name>
Then examine the events:
kubectl get events --sort-by=.metadata.creationTimestamp
Together, these commands provide different views of what is happening:
kubectl logs
    |
    └── What is the container/application saying?

kubectl describe pod
    |
    └── What is the current Pod configuration and state?

kubectl get events
    |
    └── What actions or problems has Kubernetes reported?
By combining logs, Pod descriptions, and Kubernetes events, we can monitor container activity and understand what is happening inside Pods.
More importantly, these tools allow us to troubleshoot problems by examining both the application's output and the sequence of operations performed by Kubernetes.
Comments (0)
There are no comments yet. Be the first to comment.
Log in or register to leave a comment. all comments are subject to admin approval