peter (admin) -

Understanding the Kubernetes Pod Lifecycle
Introduction
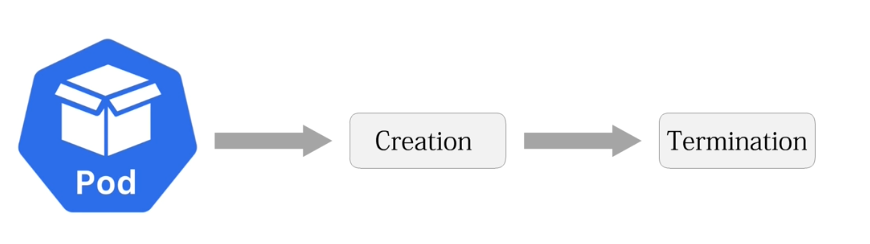 Here we will learn how a Pod moves through different stages from creation to termination and understand what happens internally during each phase of its lifecycle.
For this exercise, we are already logged into both the control-plane node and the worker node. We will create and manage Pods from the control-plane node while verifying their actual runtime behavior and state transitions directly on the worker node where they run.
Monitoring a Pod in Real Time
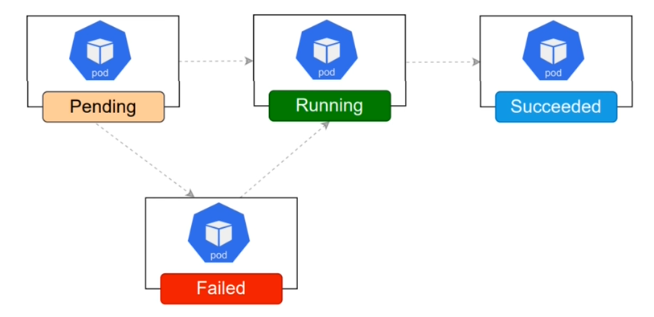 First, we monitor the
pod-internal Pod in real time so that we can observe changes during its lifecycle.
For this, we use the -w option, which means watch:
kubectl get pods -w
Alternatively, to watch only pod-internal:
kubectl get pod pod-internal -w
Kubernetes keeps the command running and displays changes to the Pod as they occur.
Initially, we might see:
NAME           READY   STATUS    RESTARTS   AGE
pod-internal   1/1     Running   0          5m
If the Pod's state changes, kubectl displays another line showing the new state.
This allows us to observe events such as a Pod starting, terminating, or being replaced.
To stop watching, press:
Ctrl+C
This exits watch mode and returns us to the terminal prompt.
Deleting the Pod
Now delete the Pod so that we can observe the termination phase of its lifecycle:
kubectl delete pod pod-internal
Kubernetes accepts the deletion request and begins terminating the Pod.
During normal termination, Kubernetes attempts to gracefully stop the containers before removing the Pod and cleaning up its resources.
Creating a New Lifecycle Pod
Next, create a fresh Pod named lifecycle-demo using the NGINX image.
We also set its restart policy to Never.
For example:
kubectl run lifecycle-demo
  --image=nginx
  --restart=Never
We create a new Pod after deleting the previous one so that we can observe a fresh lifecycle without relying on the previous Pod.
After running the command, Kubernetes should report:
pod/lifecycle-demo created
Checking the Pod State
Check the current state of the Pod:
kubectl get pods
You should eventually see something similar to:
NAME             READY   STATUS    RESTARTS   AGE
lifecycle-demo   1/1     Running   0          20s
The value:
1/1
means the Pod contains one container and that container is ready.
The status:
Running
indicates that the Pod has been scheduled and its container is running.
A restart count of:
0
means the container has not restarted.
The increasing AGE value shows how long the Pod has existed.
Monitoring the Kubelet
Now move to the worker node to examine what is happening at the system level.
The kubelet is the Kubernetes node agent responsible for ensuring that the containers assigned to its node are running as required.
We can monitor its logs with journalctl:
sudo journalctl -u kubelet -f
The -u kubelet option selects the kubelet service, while:
-f
follows new log messages in real time.
The logs can show kubelet activity associated with Pod and container management, including container operations, volume operations, resource cleanup, and Pod startup.
This allows us to see some of the work taking place on the worker node behind the Kubernetes API.
Press:
Ctrl+C
when you want to stop following the logs.
Entering a Running Container
Now return to the control-plane node and enter the web container of our previously created dual-container Pod.
Because dual-container contains two containers, we must specify exactly which container we want to access.
Run:
kubectl exec -it dual-container -c web -- /bin/sh
The options:
-i
keep standard input open, while:
-t
allocates a terminal.
The -c option specifies the container:
-c web
and:
-- /bin/sh
starts a shell inside that container.
After running the command, we are operating inside the container's environment rather than directly in the control-plane node's filesystem.
We can now explore directories, inspect files, and examine the processes running inside the container.
Examining PID 1
Inside the NGINX container, examine the command line of process ID 1:
cat /proc/1/cmdline
The /proc filesystem provides information about processes running in the container.
/proc/1/cmdline contains the command line associated with process ID 1.
For the NGINX container, the output corresponds to the NGINX master process, typically involving:
nginx
and an option that keeps NGINX running in the foreground, such as:
daemon off;
This demonstrates an important container concept: PID 1 is the main process inside the container.
For this container, that main process is NGINX.
The application needs to remain running for the container to remain active. If its main process exits, the container stops.
Leaving the Container
To leave the container shell, run:
exit
This returns us to the terminal on the control-plane node.
We are no longer operating inside the Pod's container.
Entering the Helper Container
Now enter the helper container of the same dual-container Pod:
kubectl exec -it dual-container -c helper -- /bin/sh
A prompt similar to:
/ #
may appear.
The / indicates that our current directory is the root of the container filesystem.
The # commonly indicates that the shell is running as the root user.
We are now inside the helper container rather than on the control-plane node.
Examining Processes in the Helper Container
To see the processes running inside the helper container, use:
ps
The output may look similar to:
PID   USER     COMMAND
1     root     sh -c while true; do echo helper; sleep 5; done
...
Process ID 1 is the shell command we defined when creating the helper container.
It continuously performs:
echo helper
sleep 5
inside a loop.
Depending on exactly when ps is executed, we may also see a sleep process. We will also see the ps process itself because that command is running while the process list is being generated.
This confirms that the helper container is actively executing its loop as its main workload.
Examining the Container Filesystem
We can also list the contents of the container's root directory:
ls /
The output may contain directories such as:
bin
dev
etc
home
proc
root
sys
tmp
usr
var
These directories make the environment look similar to a normal Linux filesystem.
However, we are looking at the filesystem environment available to this particular container, not the root filesystem of the worker or control-plane node.
Understanding the Relationship
This exercise demonstrates several layers involved in running a Kubernetes Pod:
Control Plane
     |
     | Pod definition
     v
Kubernetes API
     |
     | Scheduling
     v
Worker Node
     |
     v
Kubelet
     |
     v
Container Runtime
     |
     +-----------------------+
     |                       |
     v                       v
Web Container          Helper Container
     |                       |
     v                       v
NGINX PID 1            Shell Loop PID 1
From the control-plane node, we use kubectl to create, inspect, monitor, delete, and interact with Pods.
On the worker node, the kubelet works with the container runtime to ensure that the containers assigned to that node are running.
Inside each container, there is a main process represented as PID 1. In our NGINX container, this is the NGINX process. In our helper container, it is the shell loop that repeatedly prints helper.
By examining the Pod from the Kubernetes level, the worker-node level, and finally from inside the containers themselves, we can see how the different layers of the Kubernetes Pod lifecycle fit together.
Comments (0)
There are no comments yet. Be the first to comment.
Log in or register to leave a comment. all comments are subject to admin approval